ORIGINAL ARTICLE
RODRIGUEZ, Carlos Felipe Muñoz [1], RUIZ, José Arzola [2], EXPÓSITO, Andrés Parada [3], HERNÁNDEZ, Yusdel Díaz [4], FIGUEREDO, Marcos Batista , NÉRI, Thais de Souza [6], SILVA, Alexandre do Nascimento [7], FONTOURA, José Roberto de Araújo [8], MONTEIRO, Roberto Luiz Souza [9]
RODRIGUEZ, Carlos Felipe Muñoz et al. Optimal multi-objective design of plastic injection molds for clinical vials. Revista Científica Multidisciplinar Núcleo do Conhecimento. Year. 10, Ed. 01, Vol. 03, pp. 59-76. January 2025. ISSN: 2448-0959, Acess link: https://www.nucleodoconhecimento.com.br/mechanical-engineering/optimal-multi-objective, DOI: 10.32749/nucleodoconhecimento.com.br/mechanical-engineering/optimal-multi-objective
ABSTRACT
A critical review was made of previous research works, dedicated to the topic of injection molds design with different approaches, including the use of simulation and optimization procedures and tools. The work responds to the problem of selecting the most appropriate design and technology for plastic injection molding to obtain vials. A methodological approach to the analysis and synthesis of engineering systems was used, which led to the realization of a systemic analysis of the associated task, obtaining its conceptual mathematical model, its parameterization and, as a result of the subsequent internal analysis, the detailed mathematical model of the decision-making process was obtained, including the formulation of the multi-objective optimization model for obtaining the fundamental design parameters as a multi-criteria decision-making task. In conclusion, this model was adapted to the particularities of the Excel Solver application and solved with its help. Finally, the decision-making procedure was carried out with the help of this application and proposed blister manufacturing technology.
Keywords: Plastic injection molding, Engineering systems, Optimal multi-objective design.
1. INTRODUCTION
The optimization of input parameters in the injection process has been a central theme of several investigations. For example, Jung and Kim (2021) perform numerical and experimental analysis to optimize parameters such as mold temperature and injection rate, with the aim of reducing defects and improving product quality. Rocha et al. (2022) employs multi-objective optimization to minimize variables such as deformation and cycle time, while Baum et al. (2023) focus on minimizing defects such as warping and volumetric shrinkage.
In search of a more formalized approach, Huang et al. (2022) apply Taguchi’s method and gray rational analysis to optimize process variables and analyze the mechanical properties of parts. Analysis of variance (ANOVA) reveals that cooling time is the most influential variable, followed by mold temperature and melting temperature. On the other hand, Kale et al. (2021) also use Taguchi’s method and desirability hybridization function to identify an optimized parameter setting that reduces deformation and cycle time.
Similarly, Huang et al. (2021) propose an algorithm based on artificial intelligence to control input variables and compensate for deviations in process parameters. This approach, along with multiple response optimization, is applied to polypropylene samples with nano-clay and the cooling channel design is optimized to minimize deformation.
Unlike previous research, this paper presents a formal methodology for decision-making under multiple criteria in the plastic injection molding process. This methodology allows the complexity of the process to be addressed and optimized in a comprehensive manner.
2. MATERIALS AND METHODS
Next, the methodological approach presented in Arzola (2012) and in the course accessible by @sistemasdeingenieria-dr.jo976 and which will be applied to the specific case of plastic injection mold design is presented. The concatenation between the components of the approach can be represented by the general outline shown in Figure 1.
Figure 1. Schematic representation of the proposed methodological approach
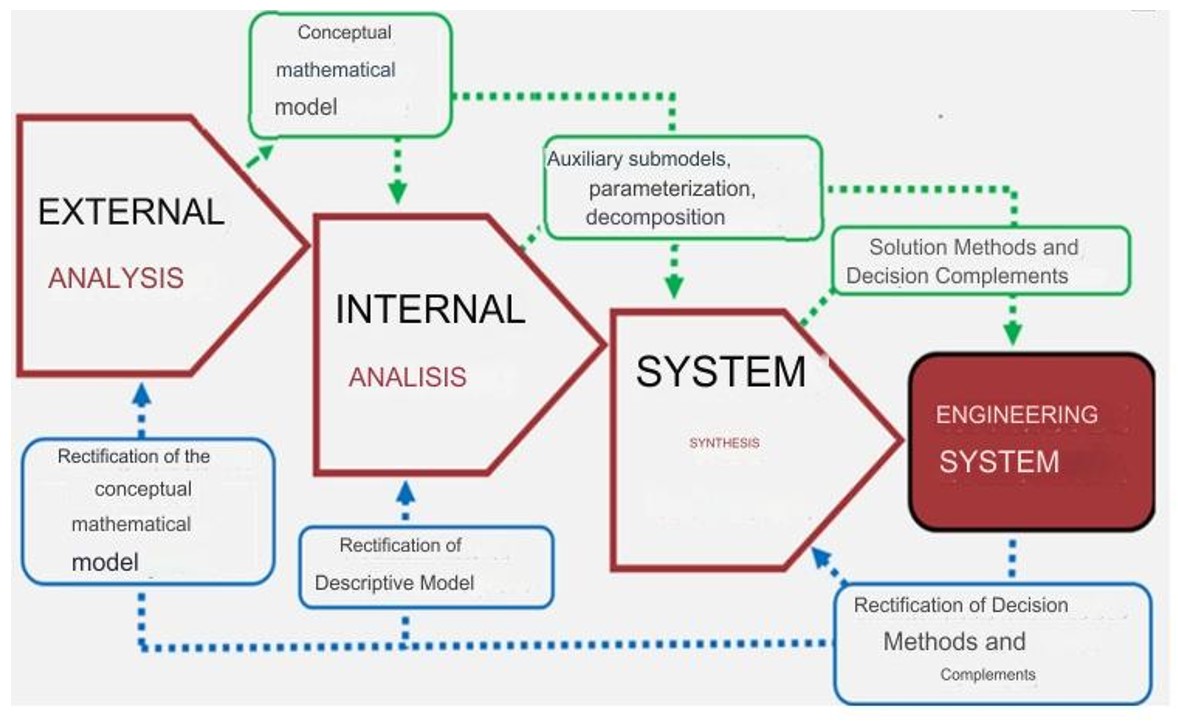
In the external analysis stage, the information associated with the task is classified into coordination variables (those that link the given system with the larger system), efficiency indicators (those that characterize the performance of the system), decision variables (those that can be modified at will at the level of the task in solution in order to vary the values of the efficiency indicators) and input data. those that have to do with all the complementary information, not directly related to decision-making. From the classification made, the conceptual mathematical model of the task under study is built, which includes the objectives and constraints, in the form of relationships. Depending on its complexity and size, the model may or may not be decomposed into component sub-models, which respond to one of four planned decision-making structures, in correspondence with its mathematical structure.
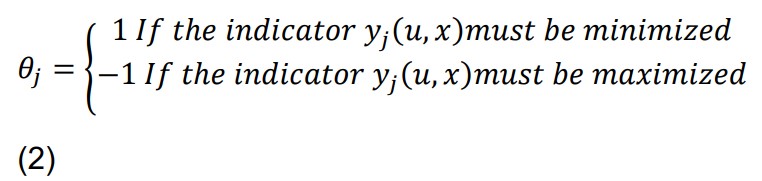
Conceptual mathematical model. It consists of the set of efficiency indicators, the preferred operators that must act on them and restricted functions. Relationships can be implicit in nature and therefore determined with the help of numerical methods.

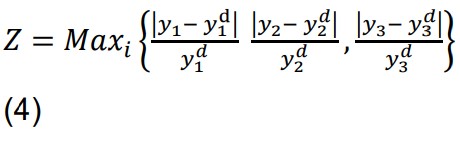
Each component of the system decision describes its state and can have its components for each element. That is, u can constitute a matrix, with columns given by ui = ui(ui1, ui2, …, uin), where uis is the coordination variable i of the element s of the system. The components of u = (u1, u2, …, up) constitute decision variables of the entire system and affect not only the quality of operation itself, given by the values of the components of Y(u, x), but also that of the larger system, of which it is a simple element. Those components of Y(u, x) that are quantifiable are replaced, in a first approximation, by the components of Z(u, x), given by ![]() .
.
Where:
The non-quantifiable components of Y(u, x) are considered a posteriori by the appropriate choice of a solution with values of the components of Z(u, x) close to:
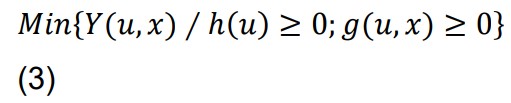
This approximates the conceptual model and represents a bi-level optimization model. Each of the elements of the system can also constitute a two-level system, so that the system in its entirety can contain multiple levels.
In the internal analysis stage , detailed mathematical modeling is carried out, so each and every one of the models resulting from the decomposition is parameterized, applying the already existing knowledge or developing it, both theoretically and experimentally, which may include the design of an experimental facility, the realization of an experimental plan and the processing of the results (António-Magaia, 2017).
The internal analysis consists of the following phases:
Rational organization of calculation procedures. The composition of the decision variables and the order of the calculations that lead to procedures with the fewest possible cycles are specified, and the algorithms for calculating the process are defined. Different methods are used here, from foundational works (Rudd & Watson, 1968) to more modern methods.
Identification of each one of the components of the conceptual mathematical model of preparation and decision-making for the different tasks derived from decomposition. A detailed description of the basic calculation procedure to be inserted in the option generation procedure is made, which may be implicit, which allows the calculation of the outputs Yj(x), Gi(x) and the determination of the complementary graphical and simulation procedures that provide the information required to specify the behavior, one by one, of the solution options generated from the basic calculation implemented in the option generation procedure.
Synthesis of engineering systems. In the synthesis, it is necessary to elaborate the procedures for the preparation of decisions, that is, the generation of solution options, their filtering and re-evaluation, by means of graphic, simulation procedures based on the consideration that the direct subjective evaluation or with the help of the known methods of multi-criteria Analysis truly reflect the system of preference of the decision-makers. the friendly implementation of the above procedures, with the addition of complementary procedures for simulation and graphical representation of solutions using systems engineering techniques and their presentation to the personnel (or other systems) in charge of selecting options for filtering, re-evaluation and selection of the final solutions.
2.1 MAIN CHARACTERISTICS OF VIALS
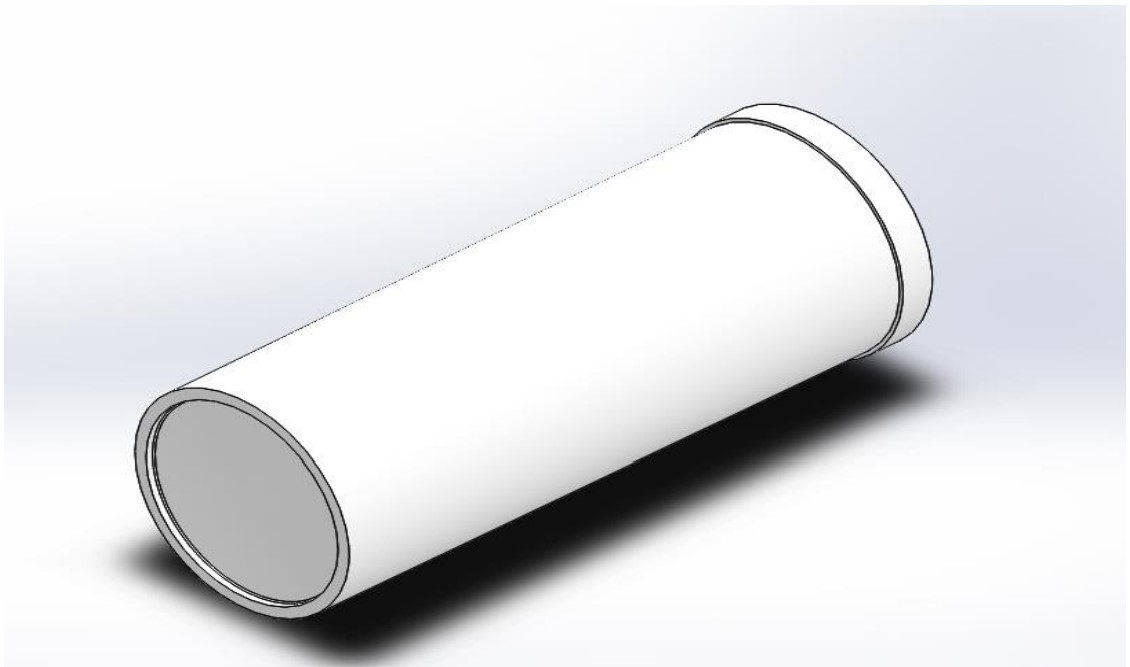
The article to be obtained through the plastic injection process is a vial for clinical use for testing, where reagents are applied to detect diseases. It needs to be transparent so that laboratory technicians can observe the samples and their characteristics. The item must have a capacity of 80 ml and be disposable. Figure 2 and Figure 3 represent a drawing of the bottle and its 3D representation, respectively. There is a regional demand of around 350,000 units per year in different laboratories and hospitals.
Figure 2. Drawing of the article
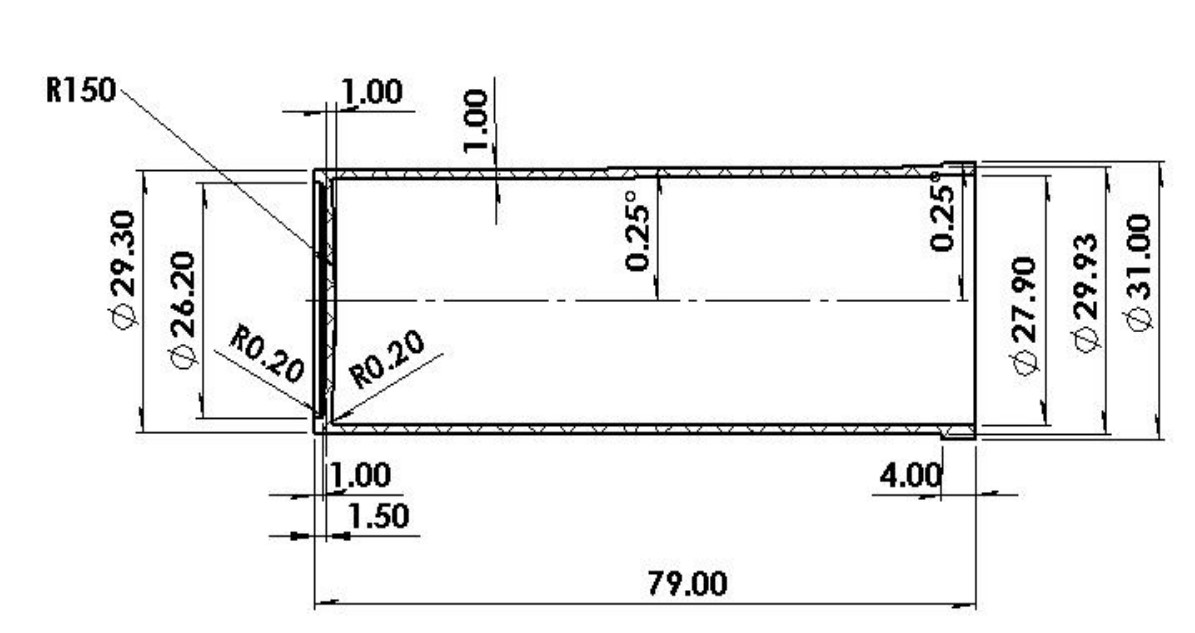
Considering its use and the quantities to be produced, the type of plastic resin to be used can be defined. The polymers suitable for this function and that meet the properties of transparency, chemical resistance, thermal stability, in addition to being harmless to health, are Polyethylene Terephthalate (PET), clarified Polypropylene (PP), General Purpose Polystyrene (PSUG) and Polycarbonate (PC).
Figure 3. 3D rendering of the article
2.1 EXTERNAL ANALYSIS
Coordination variables
Material viscosity u1
Material-specific heat u2
Material density u3
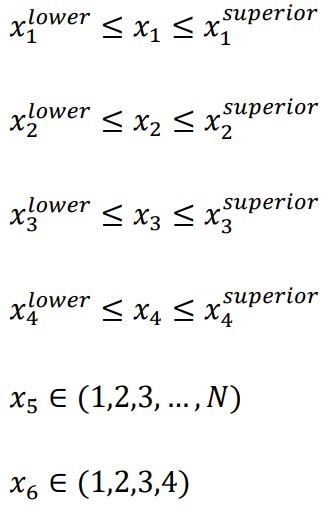
Decision variables
Injection pressure: ![]()
Melting mass temperature ![]()
Mold Temperature ![]()
Ejection temperature ![]()
Number of cavities in the mold ![]()
Vial material ![]()
Where Â+, Ν, Μ are, respectively, the actual positive, positive integer, and available material sets.
Efficiency indicators
Cost: y1 = y1 (x5, x6, y3)
Productivity: y2= y2 (x1, x2, x3, x4, x5, x6)
Energy consumption: y3= y3 (x1, x2, x5, x6)
Restricted functions
Conceptual mathematical model
It is defined as follows:
Minimize
2.2 INTERNAL ANALYSIS
Based on the conceptual model obtained and making use of the methodology described above, the Internal analysis of the task is carried out. It will be described below how the efficiency indicators are obtained, developing the detailed model for this case study.
- Cost indicator (y1)

- Productivity indicator (y2)
Due to the complexity of the injection process and the interaction of multiple variables, there is no single, universal formula for calculating productivity. However, a model was developed that considers the key factors and allows estimating the relative productivity of different mold and process configurations.

Where:
Q: Productivity
N: Number of cavities
![]() : Process efficiency
: Process efficiency
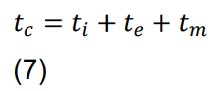
tc: Molding cycle time
Injection molding cycle times are divided into three main components: injection time, cooling time, and maintenance time. Each of these is affected by different process variables and material properties. The properties of the materials to be used are represented in Table 1.
ti: Injection time
te: Cool-down time
tm: Maintenance time
Table 1. Properties of selected polymers
| Polymer type | Density, (g/cm3) | Viscosity 100 , (Pa*s) | Specific heat, (J/g ) | Viscosity activation energy, (J/mol) |
| PET | 1.38 | 350 | 1.40 | 125 |
| PC | 1.20 | 400 | 1.22 | 140 |
| PSUG | 1.05 | 100 | 1.25 | 127 |
| PP Clarified | 0.90 | 200 | 2.00 | 120 |
Source: (Harper, 1996; Mark, 2009).
In this case, ti is defined as the time it takes for the molten material to completely fill the mold cavity. Equation (8) describes this variable.
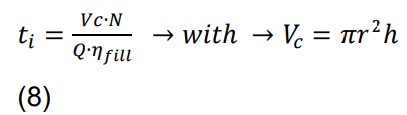
Where:
Vc: Cavity volume (cm3)
r: Cavity radius (cm)
h: Cavity height (cm)
N: Number of cavities
Q: Material flow rate (cm3/s)
![]() : Filling efficiency
: Filling efficiency
However, in Equation 8 the volumetric flow rate (Q) is not well defined since it depends on the physical and hydraulic properties of the fluid that vary with temperature and pressure, so its estimation is sometimes complex. However, in this research a simplification of the model is carried out using the Hagen-Poiseuille Law that is valid for fluids that are transported in the laminar regime within a capillary.
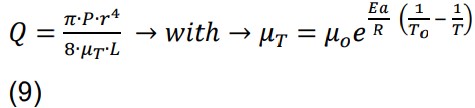
Where:
![]() : Injection pressure (MPa)
: Injection pressure (MPa)
![]() : Viscosity of the fluid at the process temperature (Pa*s)
: Viscosity of the fluid at the process temperature (Pa*s)
![]() : Viscosity of the material at a reference temperature, it will be taken 100 (Pa*s)
: Viscosity of the material at a reference temperature, it will be taken 100 (Pa*s)
![]() : Viscosity activation energy (J/mol)
: Viscosity activation energy (J/mol)
![]() : Constant of ideal gases (8.314 J/mol*K)
: Constant of ideal gases (8.314 J/mol*K)
![]() : Reference temperature (K)
: Reference temperature (K)
![]() : Material temperature (K)
: Material temperature (K)
r: Capillary radius (cm)
L: Capillary length (cm)
For the dimensions of the capillary in this case, those of the nozzle will be taken
On the other hand, it is necessary to define the te which would be the time needed for the vial to solidify sufficiently and thus not deform during ejection from the mold. To calculate it, the following expression was used:

Where:
C: Material-specific heat (J/goC)
![]() : Material density (g/cm3)
: Material density (g/cm3)
Tex: Ejection temperature (oC)
h: Surface heat transfer coefficient (W/cm2 oC)
A: Surface area of the part in contact with the mold (cm2)
TM: Mold temperature (oC)
Finally, it remains to be defined tm which includes the time of opening and closing the mold, the ejection of the part, among others.
![]()
Where:
![]() : Maintenance time (s)
: Maintenance time (s)
![]() : Opening time (s)
: Opening time (s)
![]() : Closing time (s)
: Closing time (s)
![]() : Ejection time (s)
: Ejection time (s)
On the other hand, continuous decision variables such as injection pressure x1, the temperature of the melt vial x2, mold temperature x3 and the ejection temperature x4 are given by certain limit values that are a function of the type of material x6, which are represented in Table 2 and were obtained through the specialized literature.
Table 2. Restrictions on variables
| Material | Injection pressure (MPa) | Melting vial temperature (°C) | Mold temperature (°C) | Ejection temperature (°C) |
| PC | 144≤x1≤215 | 250≤x2≤300 | 60≤x3≤80 | 100≤x4≤120 |
| PET | 162≤x1≤198 | 260≤x2≤300 | 50≤x3≤70 | 90≤x4≤110 |
| PSUG | 170≤x1≤190 | 180≤x2≤240 | 40≤x3≤60 | 80≤x4≤90 |
| PP Clarificado | 170≤x1≤190 | 180≤x2≤230 | 60≤x3≤80 | 80≤x4≤100 |
Source: (Harper, 1996; Mark, 2009).
2.3 MODEL IMPLEMENTATION
The developed model is non-linear, contains variables of a continuous and integer nature, and is implemented for the different polymers studied for this article. The aim is to obtain the optimal solutions of the desired values for each of the efficiency indicators introduced. The optimization of this model is developed with the help of the Solver application implemented in the data option of Microsoft Excel.
All data are entered by dividing them into coordination variables, decision variables, efficiency indicators, desired values, constrained functions, and auxiliary data. As the type of material is a qualitative variable, an optimization will be made for each one and the most convenient one will be chosen. Then the efficiency indicators, that is, cost, productivity and energy consumption are calculated from these variables.
Once all these parameters are selected and the solution method is chosen, the program performs the optimization procedures, modifies the values of each of the variables until it finds the efficiency indicators that are closest to the desired values. In this way, the optimal parameters for the design are obtained. Subsequently, it is verified that, both with the Generalized Reduced Gradient method and with the Genetic Algorithm method, the system offers the same solutions.
3. RESULTS AND DISCUSSION
According to the results obtained during the implementation and optimization of the model, of all the materials used to manufacture the vials studied, the one that offers the best behavior for the conditions of this case is PSUG (see Table 3). The production cost per part is the lowest and the productivity levels achieved are the most attractive of all material variants. Another result that can be derived is that, although the use of (PC) would offer lower energy consumption, if the rest of the indicators are considered, their use would not be justified.
Table 3. Efficiency indicators of the different polymers
| Indicators | PC | PSUG | PP clarificado | PET |
| Costo (¢/piece) | 6.44347 | 4.69631
|
4.78416 | 5.32323 |
| Productivity (parts per hour) | 430.73308 | 532.80715
|
435.94366 | 417.50882 |
| Energy consumption (kWh/kg) | 0.00076 | 0.00079
|
0.00093 | 0.00080 |
Source: Authors (2024).
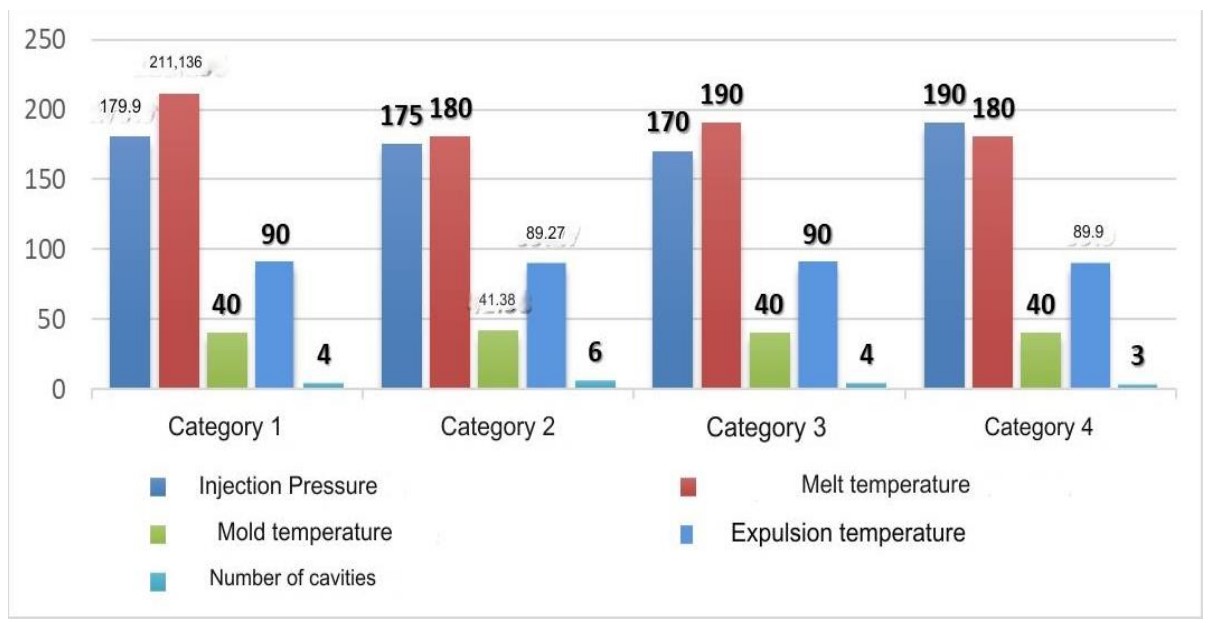
Using the decision-making procedure described above, different solutions were generated for the design of the vials, which are shown in Table 4. Each of these solutions was divided into ”Categories” that respond to specific production situations of the installation to be designed. For example, in Category 2, a process with the highest possible productivity value is sought, with a desirable value of 850 pieces/hour. In the case of Category 3, a simultaneous reduction in energy cost and consumption was sought, while maintaining acceptable productivity values. Category 4 was carried out for a process with a low energy consumption. By varying the values of the desired indicators, the solutions illustrated in Figure 4 were obtained one after another.
Table 4. Design solutions obtained for the PSUG
|
Efficiency Indicators |
Category 1 | Category 2 | Category 3 | Category 4 | ||||
| Calculated values | Desirable values | Calculated values | Desirable values | Calculated values | Desirable values | Calculated values | Desirable values | |
| Cost | 4.7 | 4.15 | 4.8 | 4.5 | 4.65
|
4.4 | 4.61 | 4.4 |
| Productivity | 565 | 600 | 836 | 850 | 583
|
600 | 457 | 550 |
| Energy Consumption | 0.00084 | 0.00097 | 0.00091 | 0.00089 | 0.00078
|
0.00075 | 0.00075 | 0.00065 |
Source: Authors (2024).
Among these solutions, Category 3 values are selected, based on the following criteria:
Selecting this injection pressure value reduces the required force exerted by the machine, resulting in lower electrical consumption by the motor.
In addition, as it is not necessary to raise the melt temperature beyond the optimal value, the service life of the heating elements is extended, and energy is saved. This not so high temperature also prevents resin degradation (loss of mechanical and optical properties) and improves the quality of the final part. By generating fewer gases, defects such as burn areas are minimized.
The proposed mold temperature value allows for more efficient cooling and shorter molding cycles. The water used in cooling comes out of the mold less hot, which reduces the need for cooling by the heat exchanger, contributing to energy savings. This also helps protect the rubber seals from cooling paths.
The slightly higher ejection temperature reduces cycle time, increasing productivity. For PSUG, which has a low shrinkage percentage, parts can be ejected at a higher temperature without affecting their dimensions, as the post-shrinkage is negligible.
A 4-cavity mold guarantees a more stable, productive and faster molding cycle, there is no imbalance in forces due to the symmetrical and uniform distribution of the parts
Figure 4. Solutions generated in the decision-making process
4. FINAL CONSIDERATIONS
The methodological approach adopted allowed a mathematical formalization of the problem of designing plastic injection molds for vials by means of the detailed multi-objective optimal design of the mold. The Microsoft Excel Solver function used allowed us to find a solution to the optimization task derived from the conceptual mathematical model using the Generalized Reduced Gradient method. The use of the model established the rational design parameters that are used in the development of the mold. Finally, the mold conceived has lower costs than similar ones offered in the international market with comparable performance.
BIBLIOGRAPHIC REFERENCES
Arzola-Ruiz, J. (2012). Sistemas de Ingeniería. Editorial Félix Varela, 2012
António-Magaia, N. I., Alemán-Romero I. L., Arzola-Ruiz J. y Martínez-Valdés O. (2017). Ajuste Posinomial mediante la combinación de Metaheurísticas y Métodos Iterativos de Programación No-Lineal CUJAE]. La Habana, Cuba.
Baum, M., Anders, D., & Reinicke, T. (2023). Approaches for numerical modeling and simulation of the filling phase in injection molding: A Review. Polymers, 15(21), 4220.
Harper, C. A. (1996). Handbook of plastics, elastomers, and composites (Vol. 4). McGraw-Hill New York.
Huang, W.-T., Tasi, Z.-Y., Ho, W.-H., & Chou, J.-H. (2022). Integrating Taguchi method and gray relational analysis for auto locks by using multiobjective design in computer-aided engineering. Polymers, 14(3), 644.
Huang, W.-T., Tsai, C.-L., Ho, W.-H., & Chou, J.-H. (2021). Application of intelligent modeling method to optimize the multiple quality characteristics of the injection molding process of automobile lock parts. Polymers, 13(15), 2515.
Jung, J. S., & Kim, S. K. (2021). Rapid Numerical Estimation of Pressure Drop in Hot Runner System. Micromachines, 12(2), 207.
Kale, P., Darade, P., & Sahu, A. (2021). A literature review on injection moulding process based on runner system and process variables. IOP Conference Series: Materials Science and Engineering,
Mark, J. E. (2009). Polymer data handbook. Oxford University Press.
Rocha, S. B., Zhiltsova, T., Neto, V., & Oliveira, M. S. (2022). Optimization to assist design and analysis of temperature control strategies for injection molding—a review. Materials, 15(12), 4048.
Rudd, D. F., & Watson, C. C. (1968). Strategy of Process Engineering. John Willey.
[1] Mechanical Engineer. ORCID: 0009-0003-1205-9093.
[2] PhD in Technical Sciences. ORCID: 0000-0002-5739-7462.
[3] PhD in Technical Sciences, Mechanical Engineer. ORCID: https://orcid.org/ 0000-0002-3120-9259.
[4] PhD in Materials Science and Engineering. ORCID: https://orcid.org/0000-0003-0381-3851. Currículo Lattes: https://lattes.cnpq.br/8250462277774753.
[5] Master’s and PhD in Computational Modeling and Industrial Technology, Bachelor’s degree in Mathematics. ORCID: https://orcid.org/0000-0002-8193-5419. Currículo Lattes: http://lattes.cnpq.br/6235735011979354.
[6] PhD in Chemistry Master’s and Bachelor’s Degree in Chemistry. ORCID: 0000-0002-5739-7462. Currículo Lattes: http://lattes.cnpq.br/7216135300068165.
[7] PhD in Computational Modeling and Industrial Technology. ORCID: 0000-0001-7436-8818. Currículo Lattes: http://lattes.cnpq.br/2937471014216142.
[8] PhD. ORCID: https://orcid.org/0000-0002-9703-835X. Currículo lattes: http://lattes.cnpq.br/7410531451699564.
[9] PhD. ORCID: https://orcid.org/0000-0002-3931-5953. Currículo Lattes: http://lattes.cnpq.br/4168723811261149.
Material received: December 9, 2024.
Material approved by peers: December 16, 2024.
Edited material approved by authors: January 13, 2025.